The problem
The numbers existed. Budget and commitments in Procore, direct costs in Procore, payments in Xero, retention in someone's head. Once a month the finance manager built a spreadsheet that put them together. By the time it was read, it was three weeks old.
What we built
A single web page that pulls from Procore's budget, commitments, direct costs and change orders, and shows per cost code: revised budget, committed, claims, direct costs, paid, remaining, and a progress bar. Five headline figures across the top. Spend by month as a bar chart, so the shape of the project is visible at a glance.
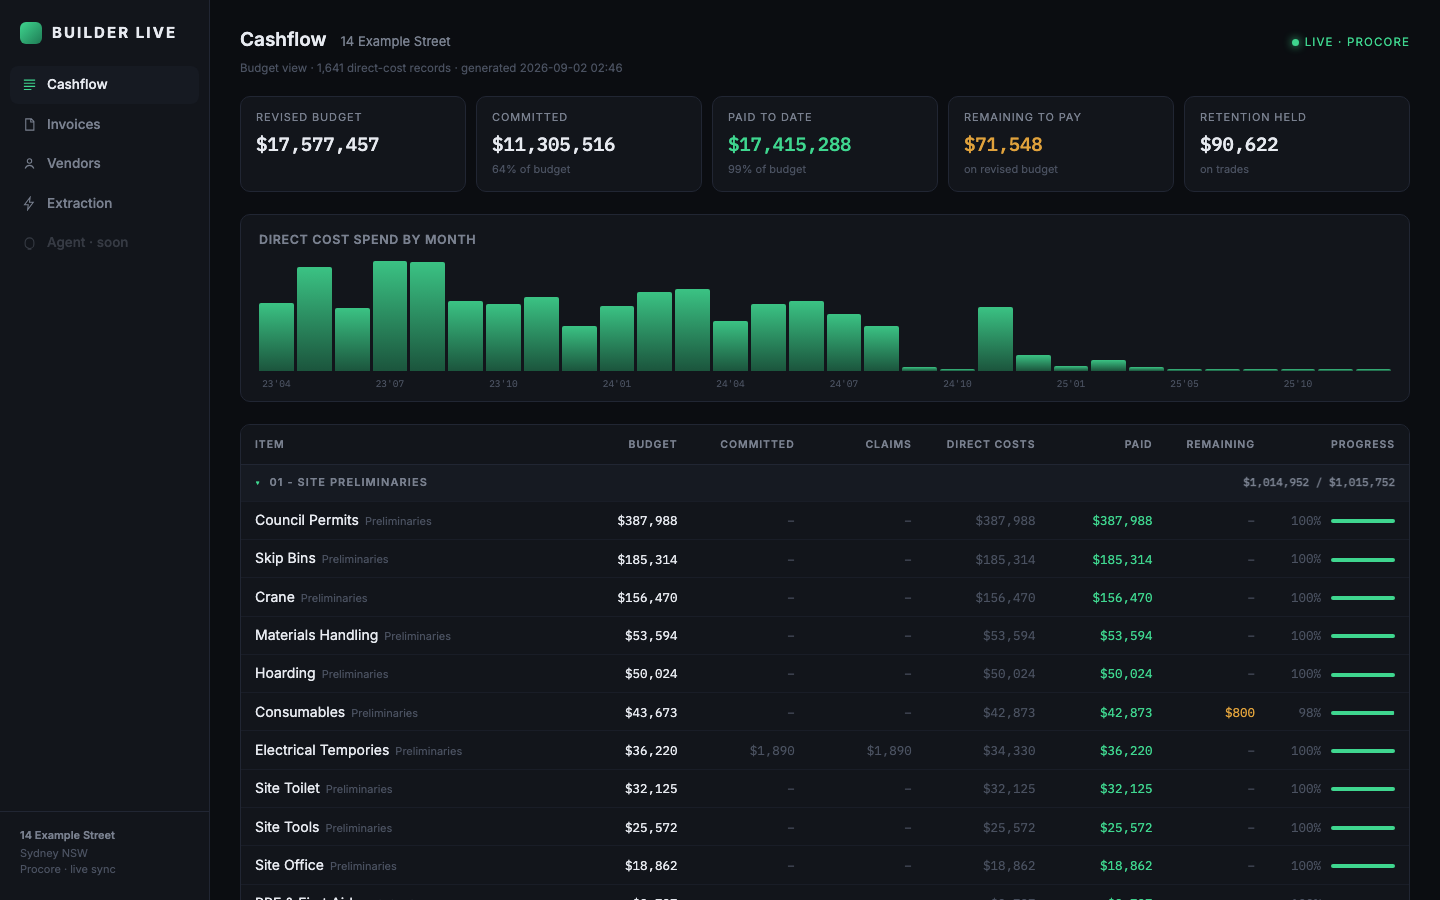
It is plain HTML with the data baked in at generation time. No login to a BI tool, no licence, opens on a phone. It regenerates on a schedule and on demand.
What it changed
Retention held on subcontractors was visible as a number for the first time. Cost codes that were over budget showed up in orange before month end, not after. The monthly spreadsheet stopped.
What is next
Bank balance and upcoming claims, so the page shows cash position and not only cost position. And the drift report alongside it, so the Procore numbers can be trusted.